
A catch goes down in the slips. The batter is on 12. The drop costs nothing yet. Two hours later, the batter is on 120. The match has turned. The dropped catch sits at the centre of the story.
Catch efficiency measures how often fielders convert their chances. The number tells you how reliable the fielding side is. A high efficiency means safe hands. A low efficiency means spilled chances.

This guide explains catch efficiency in cricket. What it means. How it works. The limits. What it tells you. What it does not.
Two Numbers Behind Every Chance
Catch efficiency rests on two counts. The catches taken. The chances offered.
The catches taken are the conversions. The ball goes up. The fielder gets there. The catch sticks. The count climbs by one.
The chances offered are every catchable opportunity. The ball goes up. The fielder gets there. The moment is recorded. Whether the catch sticks or not, the chance counts.
The two counts feed the efficiency. A side that takes 17 of 20 chances sits at 85%. A side that takes 13 of 20 sits at 65%. The difference decides matches.
Catch efficiency in cricket has grown in importance. The early scorecards tracked catches taken as a simple count. The modern game added the chance count. The tracking systems record every catchable moment. The efficiency measures the conversion rate.
The number is simple to read. A higher percentage means the fielders take most of the chances. A lower percentage means the opposite. Cricket terminology treats this as a key fielding metric. Sports statistics place it alongside the batting and bowling data for full match analysis.
The statistic captures reliability. A fielding side with high catch efficiency saves runs. A side with low efficiency gives them away. The difference shows in the scoreboard.
Explore More: Dafabet-Partnership Runs: A Guide to Cricket Data and Interpretation
Turning Chances Into a Percentage
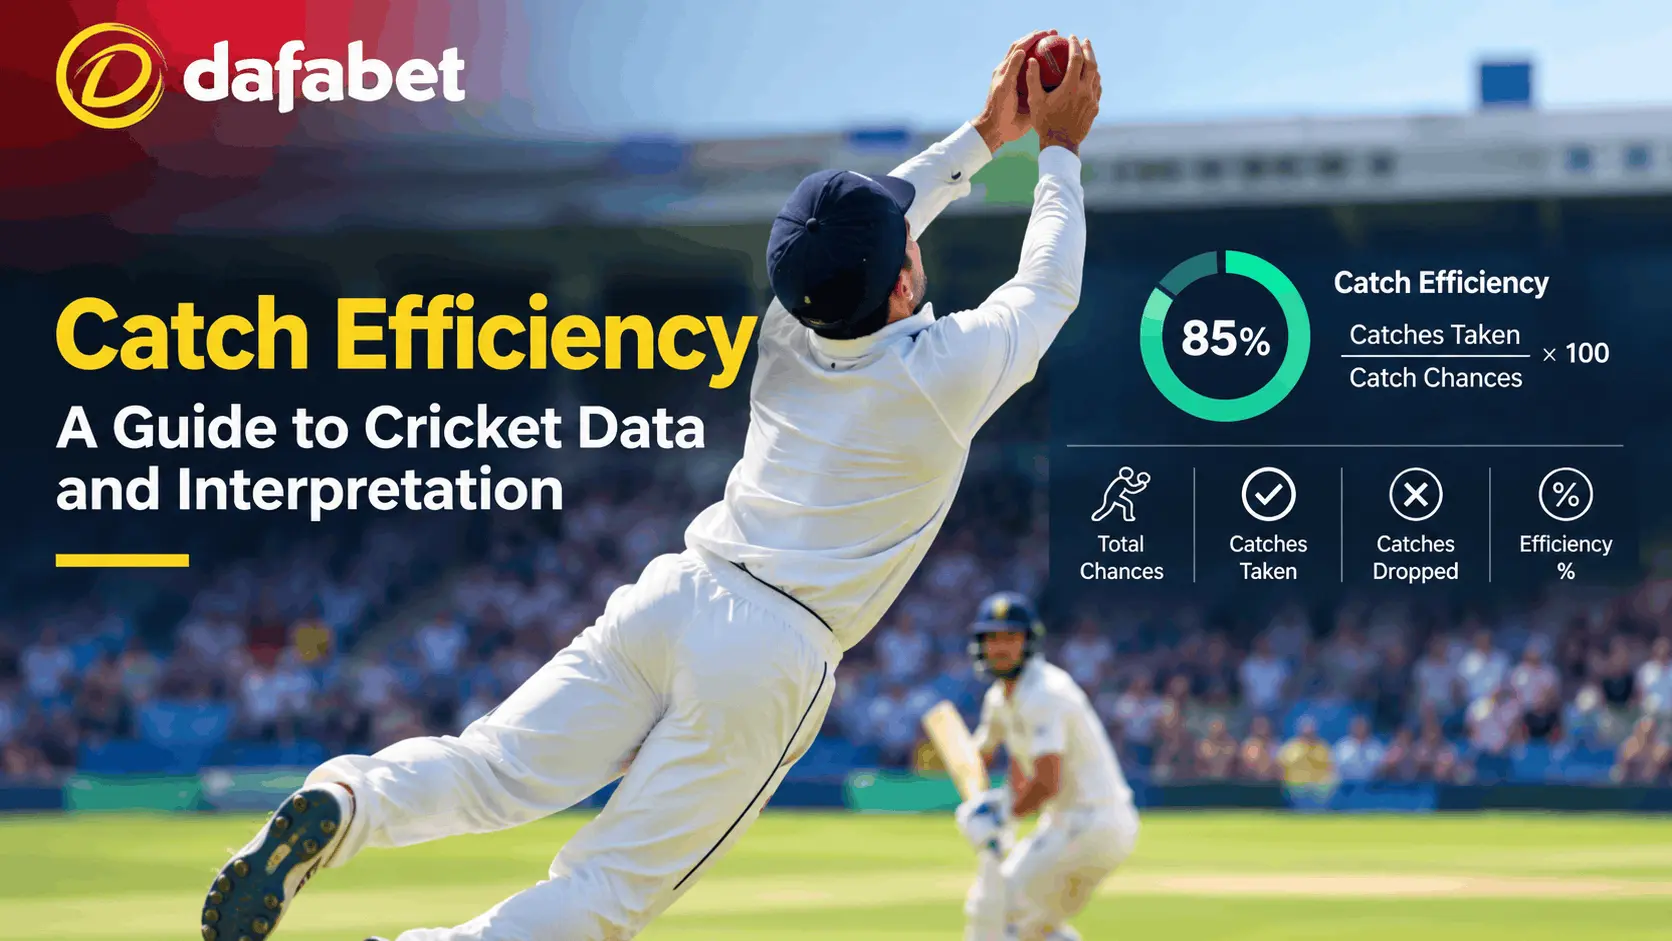
The catch efficiency formula is straightforward.
Catch Efficiency = (Catches Taken ÷ Catch Chances) × 100
The result is a percentage. 90% means the fielders take nine of every ten chances. 75% means three of every four.
The key detail is the chance definition. A chance is a catchable opportunity. Not every ball that goes near a fielder counts. The tracking system defines the threshold. The reaction time. The distance. The difficulty. The system records the chance.
The catches taken count the conversions. The catches dropped count the misses. The two add to the total chances. The division produces the efficiency.
The calculation runs through the match or the tournament. A fielding side that takes 18 of 20 chances has 90% efficiency. A side that takes 15 of 20 has 75%. The difference matters.
Cricket rules define what counts as a catch. The fielders must hold the ball cleanly. The ball must not touch the ground. The catch must be completed inside the field of play. The efficiency respects the definition.
20 Chances, 17 Taken
Take a fielding side in a T20 match. They face 20 catch chances through the innings. They take 17. They drop 3.
The calculation is (17 ÷ 20) × 100 = 85%. The catch efficiency is 85%.
That is a solid figure. The fielders took most of the chances. The three drops cost the side. Each drop gave the batter a life. The lives added runs. The final total climbed.
Now take a different side. They face 20 chances. They take 13. They drop 7.
The calculation is (13 ÷ 20) × 100 = 65%. The efficiency is 65%.
That is a poor figure. The fielders dropped seven chances. The batters survived. The score climbed. The match slipped away.
The two sides show the range. The first side held their chances. The second did not. The catch efficiency captures the difference.
Why Safe Hands Matter
A high catch efficiency means the fielders take most of the chances. Reliable hands. Few drops.
The fielders anticipate the ball. They read the trajectory. They get into position early. They hold the catch. The routine chances convert.
Player performance is tied to this. A fielder with high catch efficiency is an asset. The captain trusts them with the tough positions. The slip cordon. The deep outfield. The boundary riders.
In T20 cricket, the high efficiency saves runs. A dropped catch can cost 20 to 30 runs. The batter survives. The strike rate climbs. The final total climbs.
In ODI and Test cricket, the high efficiency builds pressure. The bowling side knows the catches will be taken. The bowlers attack. The fielders back them up.
The high efficiency also lifts the team. A sharp catch changes the mood. The fielding side celebrates. The batting side feels the pressure. The momentum shifts.
The Price of a Dropped Chance
A dropped catch changes the match. The statistic measures the frequency. The cost shows in the score.
The batter survives. The innings continues. The runs pile up. A drop on 10 may cost 90 runs. A drop on 50 may cost 50 more. The final total shifts.
The dropped catch also lifts the batting side. The batter gets a second life. The confidence climbs. The other batters feed off the moment.
The bowling side feels the drop. The bowler bowls a good ball. The chance goes down. The frustration builds. The next ball may be looser. The runs follow.
The catch efficiency tracks the drops. The number shows the pattern. A side with low efficiency loses matches it should win.
Difficulty Is Not Priced In
Catch efficiency does not tell the whole story. Here is where the number falls short.
Difficulty. A simple catch and a spectacular catch count the same. The statistic does not adjust for the position. A slip catch at ankle height is harder than a lob at mid-off. Both count as one chance. The efficiency treats them the same.
The tracking dependency. The chance definition depends on the tracking system. Hawk-Eye and other systems set the threshold. A different system may count a different number of chances. The efficiency shifts with the system.
The match situation. A dropped catch in a dead match counts the same as a dropped catch in a final. The statistic does not weigh the context.
The pressure factor. A routine catch under pressure counts the same as one in a relaxed moment. The statistic does not capture the mental side.
Match analysis uses catch efficiency as one input. Not the only one. The statistic is a starting point. The context completes the picture.
The limits do not make the statistic useless. They define what it can and cannot do. The catch efficiency tells you about reliability. It does not tell you about difficulty. Both matter. The reader needs both.
The Slip Cordon vs the Outfield
The fielding positions face different chances. The slip cordon differs from the outfield.
The slip cordon. The close catchers. The edges fly at pace. The reaction time is short. The chances are hard. The best fielders stand in the slips.
The outfield. The deep catchers. The ball hangs in the air. The fielder has time. The chances are easier. The routine catches should stick.
The catch efficiency does not separate the positions. A fielding side may take every outfield chance but drop half the slip chances. The overall efficiency sits in the middle. The position-specific picture differs.
The modern analysis tracks the position-specific efficiency. The slip efficiency. The outfield efficiency. The data breaks down the chances. The captain picks the fielders for each role.
Cameras, Data, and the Modern Chance Count
The modern tracking systems record the chances. Hawk-Eye and other systems sit at the ground. The cameras follow the ball. The system logs every catchable moment.
The chance identification. The system flags the catchable balls. The threshold applies. The distance. The reaction time. The difficulty. The system records the chance.
The conversion tracking. The system records the catch or the drop. The data feeds the efficiency. The statistic updates in real time.
The position data. The system tracks the fielder’s position. The slip chances separate from the outfield. The data breaks down the efficiency by position.
The tracking has changed the fielding analysis. The teams use the data. The coaches plan the fielding drills. The efficiency numbers guide the selection.
What the Numbers Look Like
The benchmarks shift by format and level. In international cricket, a catch efficiency above 85% is strong. Between 75% and 85% is average. Below 75% is a concern.
The slip cordon sits lower. A slip efficiency of 70% to 80% is strong. The outfield sits higher. An outfield efficiency of 90% is expected.
These ranges are guides. They shift with eras. They shift with tracking systems. The modern game tracks more chances. The efficiency numbers reflect that.
The reader should check the position. A 75% efficiency overall may hide a 90% outfield rate and a 60% slip rate. The breakdown matters. The overall number alone does not tell the full story.
Read More: Dafabet-Boundary Percentage: A Guide to Cricket Data and Interpretation
Catch Efficiency and the Other Fielding Metrics
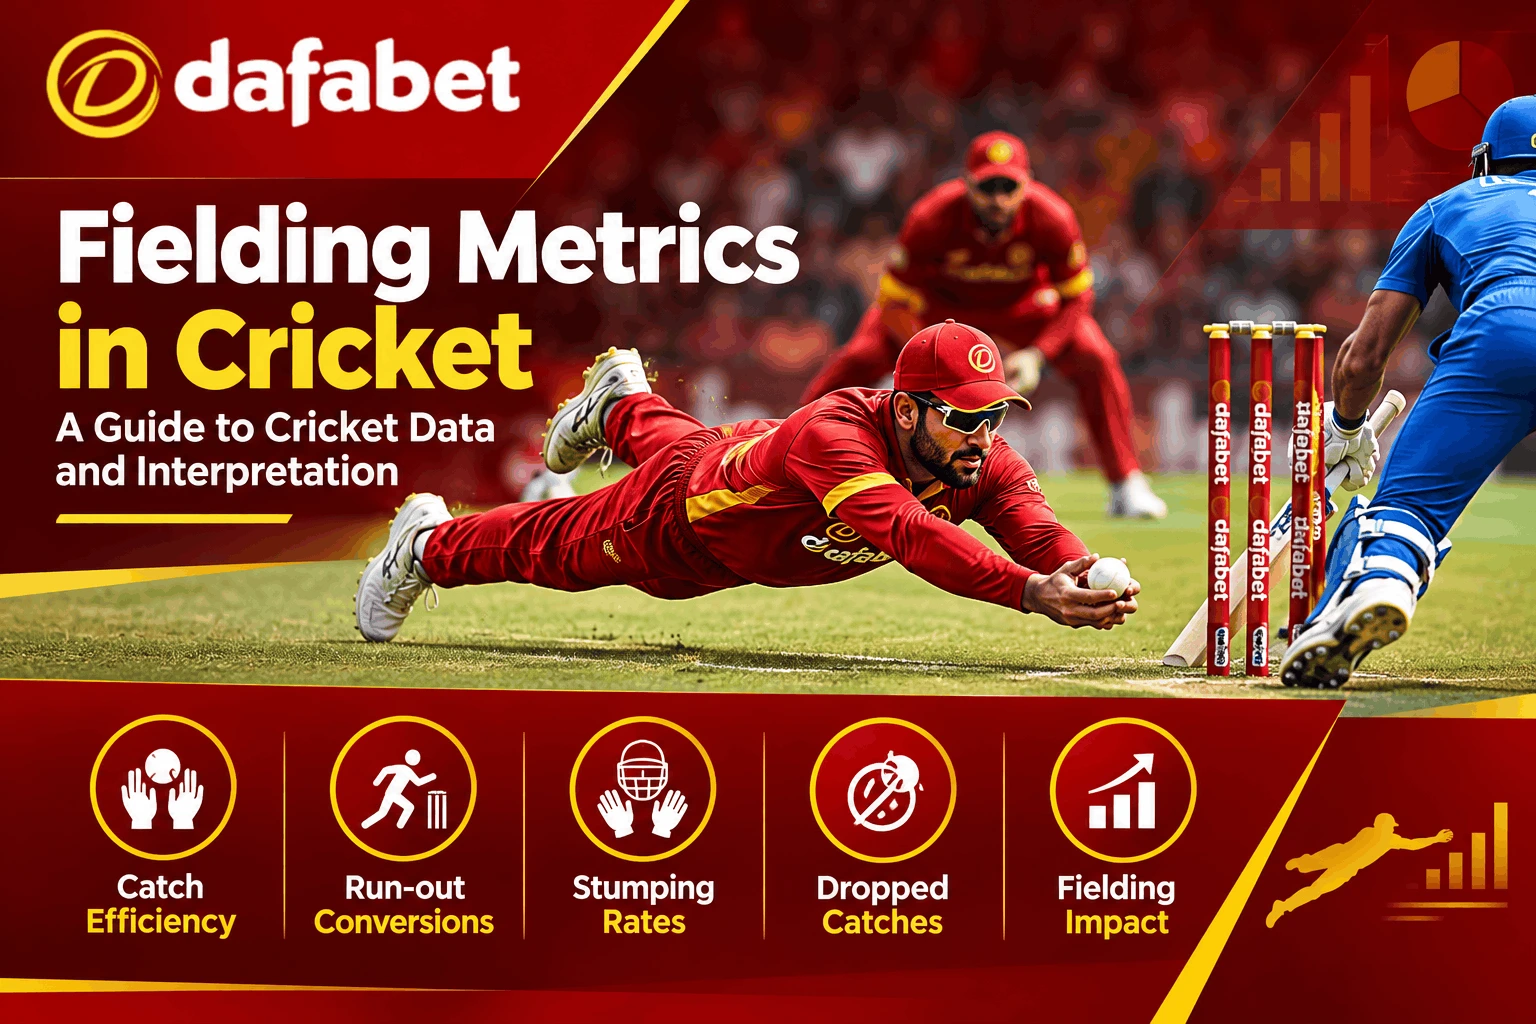
Catch efficiency sits inside the fielding metric family. The other metrics cover different fielding actions.
Run-out conversions. The percentage of run-out chances converted. The direct hits and the relay throws.
Stumping rates. The percentage of stumping chances converted. The wicketkeeper’s domain.
Dropped catch counts. The raw count of drops. The efficiency uses the same data.
Fielding impact. The overall runs saved or given away. The composite metric.
The fielding family covers the full defensive side. The catch efficiency is one piece. The modern analysis reads the family together.
The batting and bowling stats dominate the headlines. The fielding stats win the quiet matches. The catch efficiency sits at the centre of the fielding analysis.
The Takeaway for the Modern Game
Catch efficiency explained is simple. Catches taken divided by chances offered. The statistic measures reliability. It tells you how often the fielders convert.
The formula matters. The chance definition depends on the tracking system. The distinction shapes the number.
The limits matter too. Catch efficiency does not adjust for difficulty. It does not weigh the match situation. The statistic is one input among many. The modern game reads it alongside the position-specific data.
Catch efficiency in cricket has grown from a simple count to a core metric. It defines the modern fielding side. Understanding how catch efficiency works is the key to reading the fielding data.