
Two batters finish on 60. The first reaches the score with five sixes and three singles. The second reaches it with ten singles and two fours. The runs are the same. The innings are not.
Boundary percentage explains the difference. It measures how much of a batter’s score comes from fours and sixes. A high percentage means the batter relies on boundaries. A low percentage means the batter rotates the strike.

This guide explains boundary percentage in cricket. How it works. How to calculate it. How to read it. The two versions of the statistic. The limits. What it tells you. What it does not.
What Boundary Percentage Is
Boundary percentage measures how much a batter relies on fours and sixes. The statistic tracks the proportion of runs or balls that produce a boundary.
The statistic applies to all formats. Test. ODI. T20. The benchmark shifts. The concept stays the same.
Boundary percentage in cricket has grown in importance. The early scorecards tracked boundaries. But the statistic sat behind the batting average in prominence. The modern game changed that. T20 cricket made boundary-hitting the primary currency. The boundary percentage measures that reliance.
The number is simple to read. A higher percentage means the batter scores in boundaries. A lower percentage means the opposite. Cricket terminology treats this as a key batting metric. Sports statistics place it alongside the strike rate for modern analysis.
The statistic captures approach. A batter with a high boundary percentage looks to clear the ropes. A batter with a low percentage looks to rotate the strike. Both approaches work. The boundary percentage tells you which one the batter uses. Cricket rules on scoring apply to both fours and sixes.
The Two Versions Explained
Two versions of the statistic exist. They measure different things. The distinction matters.
Runs-based boundary percentage. The proportion of a batter’s runs that come from boundaries.
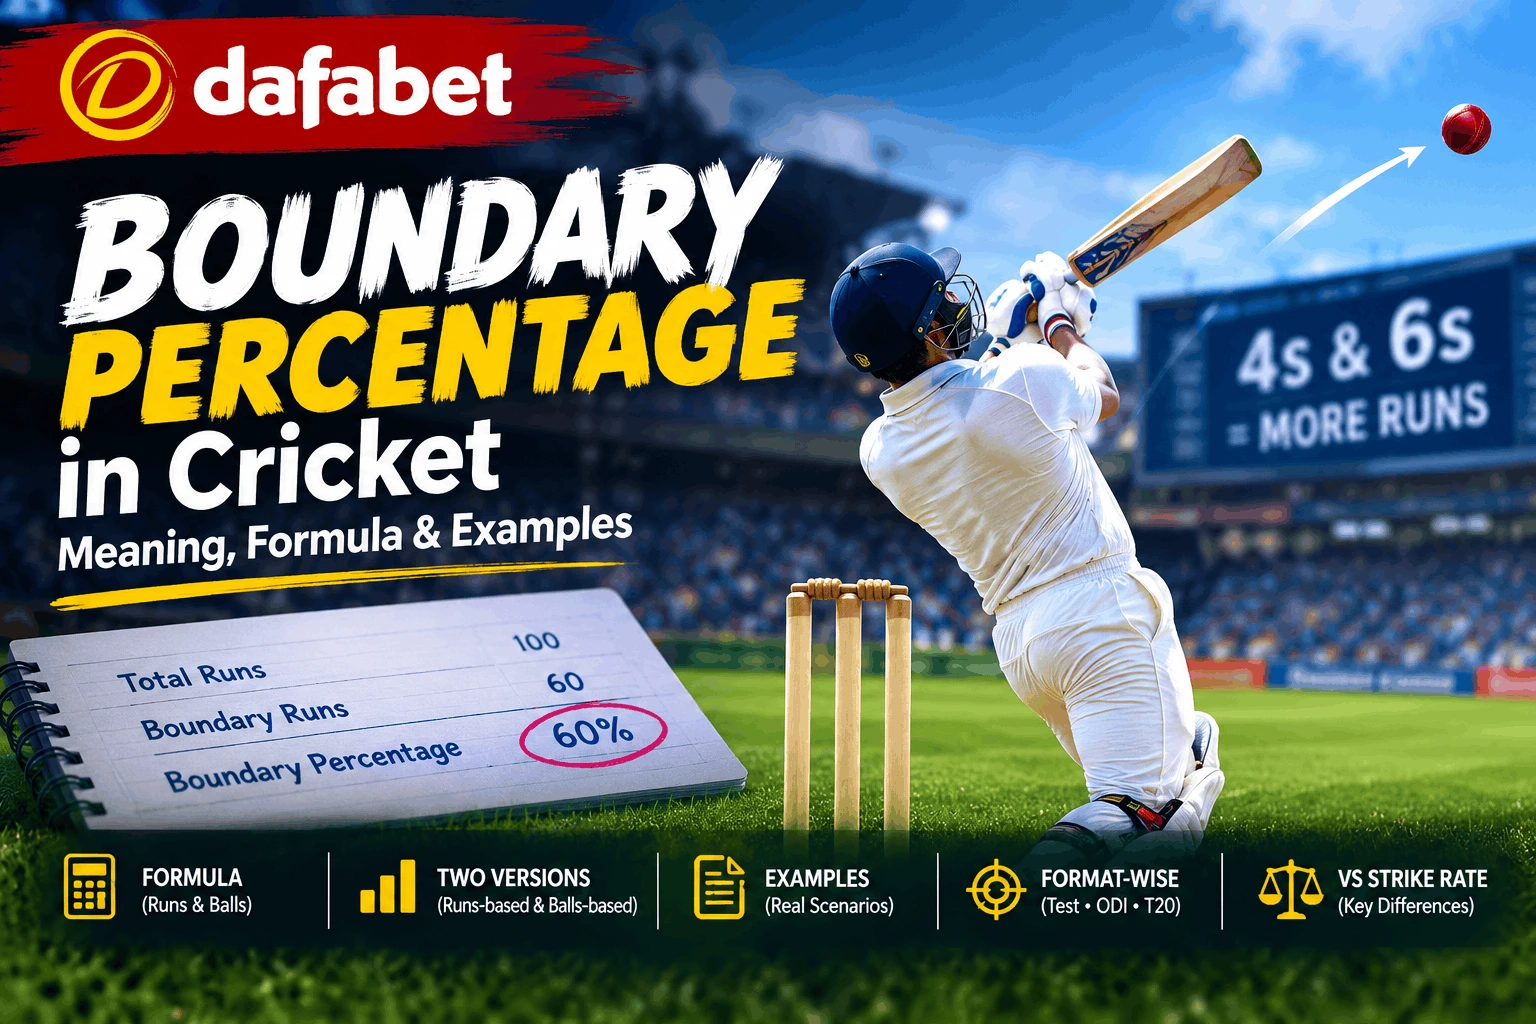
Runs-Based Boundary Percentage = (Boundary Runs ÷ Total Runs) × 100
A batter scores 80. Sixty of those runs come from boundaries. The calculation is (60 ÷ 80) × 100 = 75%. The batter relied on boundaries for three-quarters of the score.
Balls-based boundary percentage. The proportion of deliveries that produce a boundary.
Balls-Based Boundary Percentage = (Boundary Balls ÷ Total Balls Faced) × 100
A batter faces 50 balls. Twelve of those deliveries go for four or six. The calculation is (12 ÷ 50) × 100 = 24%. The batter hits a boundary roughly once every four balls.
The two versions answer different questions. The runs-based version asks: how much of the score came from boundaries? The balls-based version asks: how often did the batter hit a boundary?
Both are used in analysis. The runs-based version suits match reports. The balls-based version suits scouting. The reader should check which version a statistic uses.
Read More: Dafabet-How to Download and Use the Dafabet Mobile App
A Worked Example
Take a batter in a T20 innings. They score 75 off 45 balls. Here is the breakdown.
Boundaries. Eight fours and three sixes. That is 11 boundary hits.
Boundary runs. Eight fours = 32 runs. Three sixes = 18 runs. Total = 50 runs.
Non-boundary runs. 75 − 50 = 25 runs.
Balls faced. 45.
Boundary balls. 11.
Now apply both formulas.
Runs-based. (50 ÷ 75) × 100 = 66.67%. Two-thirds of the score came from boundaries.
Balls-based. (11 ÷ 45) × 100 = 24.44%. Roughly one in four deliveries went for a boundary.
The two numbers tell the story. The batter relied on boundaries for most of the score. They also hit a boundary roughly every four balls. The innings was boundary-heavy.
Now take a different batter. They score 75 off 60 balls. They hit four fours and one six. That is five boundary hits.
Boundary runs. Four fours = 16 runs. One six = 6 runs. Total = 22 runs.
Non-boundary runs. 75 − 22 = 53 runs.
Runs-based. (22 ÷ 75) × 100 = 29.33%.
Balls-based. (5 ÷ 60) × 100 = 8.33%.
This batter built the score through singles and twos. The boundaries were occasional. The strike rate was lower. The boundary percentage reflects the approach.
What a High Boundary Percentage Tells You
A high boundary percentage means the batter scores in fours and sixes. Aggressive intent. The runs come quickly.
The batter looks to clear the infield. They take on the bowlers. They target the short boundaries. The score climbs in bursts.
Player performance is tied to this in T20 cricket. A batter with a high boundary percentage is a match-winner. The team can post big totals. The chase becomes easier. The required rate stays under control.
In ODI cricket, the boundary percentage matters through the middle overs and the death. A batter who hits boundaries keeps the innings moving. A batter who does not drags the total down.
In Test cricket, the boundary percentage still matters. But the value shifts. A batter with a high percentage can change the game quickly. A batter with a low percentage can bat the opposition out of the match.
The high percentage also reflects the role. A T20 opener with a high boundary percentage sets the tone. A finisher with a high percentage closes the innings. The approach suits the role.
What a Low Boundary Percentage Tells You
A low boundary percentage means the batter rotates the strike. Singles and twos. The runs come steadily.
This is not always a negative. A Test opener facing a new ball on a seaming pitch may score slowly. The role is to survive. The boundary percentage is low. The value is high.
The context matters. A top-order batter in T20 cricket with a low boundary percentage is a problem. The team loses momentum. The required rate climbs.
The role shapes the expectation. A Test anchor is judged on time at the crease. A T20 finisher is judged on boundary-hitting. The boundary percentage reflects the second role better than the first.
A low percentage also signals the style. The batter looks to run. They find the gaps. They convert ones into twos. The approach works in the middle overs. It builds the platform for the hitters.
What Boundary Percentage Misses
Boundary percentage does not tell the whole story. Here is what the number leaves out.
Consistency. A batter with a high boundary percentage may get out quickly. The statistic does not measure how long the batter stays in. A 20-ball 40 with five boundaries and a 100-ball 40 with five boundaries have the same runs. The first innings was a cameo. The second was an anchor. The boundary percentage treats both the same.
The boundary type. A four and a six both count as boundaries. The statistic does not distinguish. A batter who hits sixes scores faster than one who hits fours. The boundary percentage does not capture the difference.
Match situation. A batter scoring boundaries in a losing cause counts the same as one in a winning cause. The statistic does not weigh the context.
Pitch conditions. A high boundary percentage on a flat pitch may be standard. The same percentage on a turning track may be exceptional. The statistic does not adjust for the surface.
Match analysis uses boundary percentage as one input. Not the only one. The statistic is a starting point. The context completes the picture.
The limits do not make the statistic useless. They define what it can and cannot do. The boundary percentage tells you about the batting approach. It does not tell you about consistency. Both matter. The reader needs both.
Boundary Percentage Across Formats
The statistic varies by format.
Test cricket. Boundary percentages are usually lower. Test matches last five days. Batters build slowly. Boundary runs make up 30% to 50% of a typical score.
ODI cricket. Boundary percentages sit in the middle. 50-over matches give batters time. Boundary runs make up 40% to 60% of a typical score. Elite ODI batters rely on boundaries for over half their runs.
T20 cricket. Boundary percentages are higher. The format rewards aggression. Boundary runs make up 50% to 70% of a typical score. Elite T20 batters rely on boundaries for most of their runs.
The difference matters for interpretation. A 50% boundary percentage in Test cricket is aggressive. The same number in T20 cricket is standard. The format shapes the number.
The Modern Game: Boundaries and Strike Rate
Modern cricket has changed the approach. Batters hit more boundaries than ever.
The T20 format drove the shift. The short boundaries. The flat pitches. The power-hitting. Batters look to clear the ropes from the first ball.
The strike rate followed. The boundary percentage and the strike rate move together. A batter who hits more boundaries scores faster. The strike rate climbs. The two statistics tell the same story from different angles.
The modern game rewards the boundary-hitter. The six-hitting. The powerplay assault. The death-over finishing. The boundary percentage measures the aggression.
The shift has changed the batting order. Teams pick hitters at the top. The anchors sit in the middle. The finishers close the innings. The boundary percentage defines the roles.
How to Read Boundary Percentages
The benchmarks shift by format. In Test cricket, a runs-based boundary percentage of 40% to 50% is standard. Above 55% signals an aggressive batter.
In ODI cricket, 50% to 60% is standard. Above 65% signals a boundary-reliant batter.
In T20 cricket, 55% to 65% is standard. Above 70% signals a heavy reliance on boundaries.
The balls-based version sits lower. In T20 cricket, a balls-based boundary percentage of 15% to 25% is common. Above 25% signals a frequent boundary-hitter.
These ranges are guides. They shift with eras. They shift with roles. The modern game has higher boundary percentages. The benchmarks reflect that.
Boundary Percentage vs Strike Rate
A batter finishes on 75 off 45 balls. The strike rate sits at 166.67. The boundary percentage sits at 66.67%. The two numbers tell related stories. Here is how they connect.
Strike rate. Runs scored per 100 balls. Measures scoring speed. A high number is good for the batter.
Boundary percentage. The proportion of runs or balls from boundaries. Measures boundary reliance. A high number signals aggression.
The two statistics move together most of the time. A batter with a high boundary percentage usually has a high strike rate. The boundaries drive the scoring. The rate climbs.
But the two can diverge. A batter may hit boundaries rarely but run well between the wickets. The strike rate stays high. The boundary percentage stays low. The reverse can happen. A batter may hit boundaries often but face many dot balls. The boundary percentage stays high. The strike rate drops.
The two statistics are read together. The boundary percentage shows the approach. The strike rate shows the output. Both matter. The reader needs both.
When a commentator mentions boundary percentage, the context is approach. When the context is scoring speed, the statistic is the strike rate. The two are not interchangeable.
Explore More: Dafabet-Dafa Sports Cricket: A Practical Guide to Online Cricket Betting
The Bottom Line: A Statistic Worth Understanding
Boundary percentage explained is simple. The proportion of runs or balls from fours and sixes. The statistic measures boundary reliance. It tells you how a batter scores.
The calculation matters. Two versions exist. The runs-based version and the balls-based version. The distinction shapes the number.
The limits matter too. Boundary percentage does not measure consistency. It does not capture the boundary type. The statistic is one input among many. The modern game reads it alongside the strike rate.
Boundary percentage in cricket has grown from a secondary metric to a core one. It defines the modern batter. Understanding how boundary percentage works is the key to reading the modern game.