
The required rate is climbing. Six balls. No runs. The batter at the crease is stuck. The bowler hits the same length. The pressure builds. The next ball is short. The batter goes for the pull. The top edge carries to fine leg. The wicket falls.
That is the power of the dot ball. The scoreless delivery builds pressure. The pressure produces the mistake. The mistake produces the wicket.

Dot ball percentage measures that pressure. It tracks the proportion of deliveries that produce no runs. A high percentage means the bowler is controlling the game. A low percentage means the batting side is scoring freely.
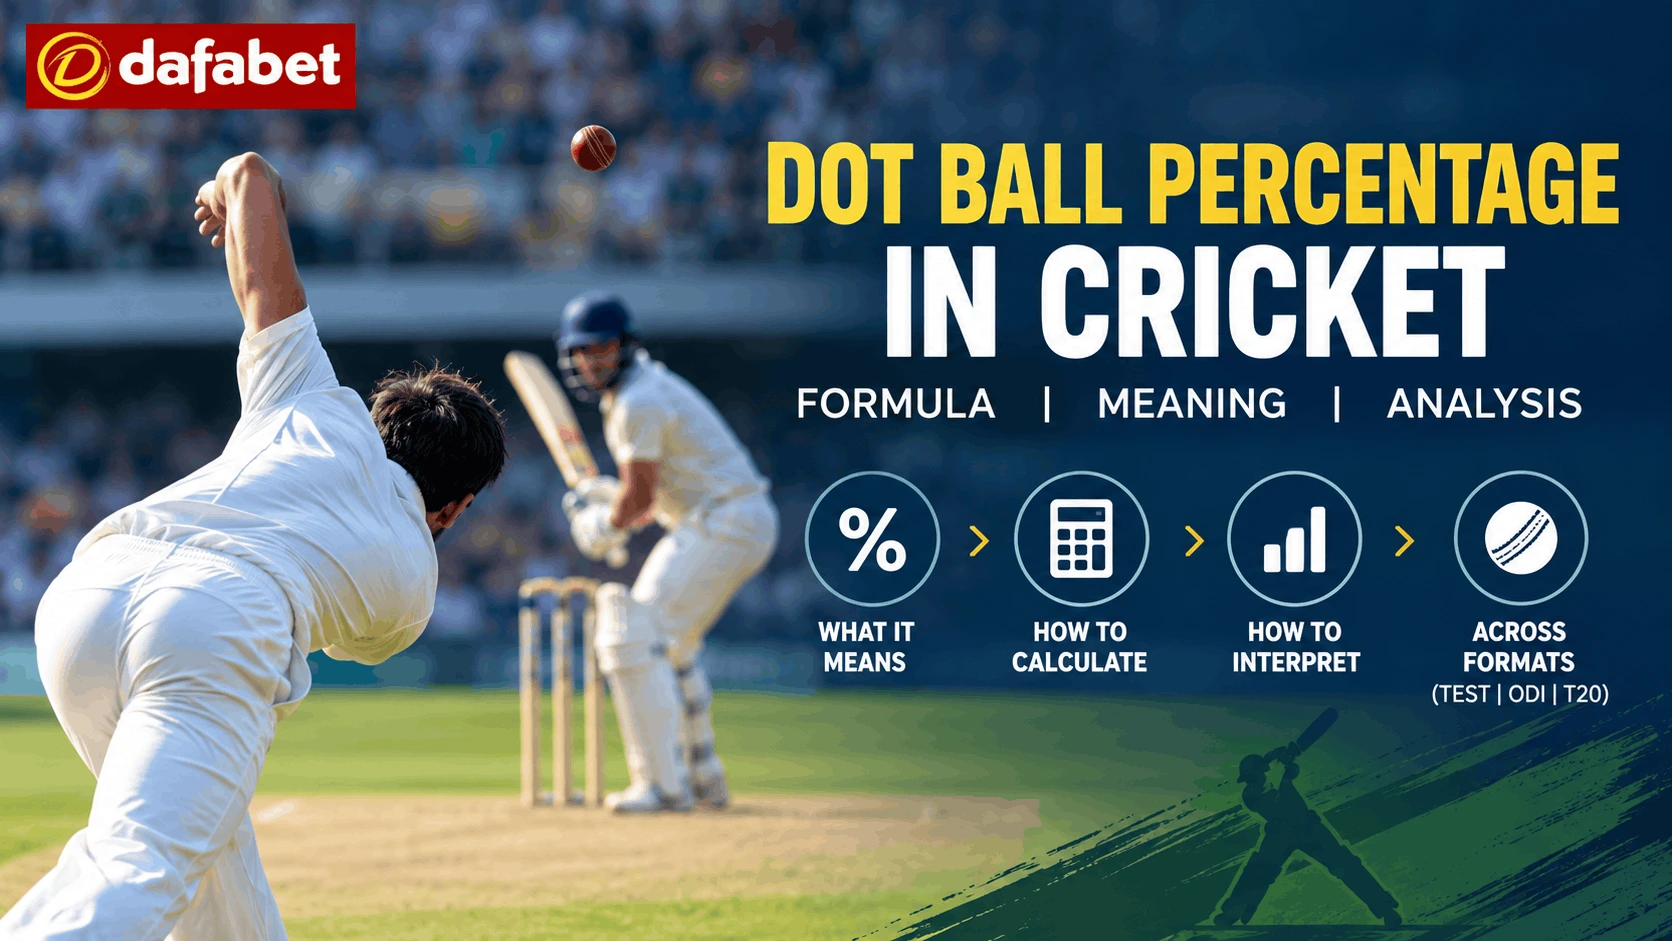
This guide explains dot ball percentage in cricket. How it works. How to calculate it. How to read it. The limits of the statistic. What it tells you. What it does not.
What Dot Ball Percentage Is
Dot ball percentage measures the proportion of deliveries that produce no runs. A dot ball is a delivery where the batting side scores nothing. No run off the bat. No extra. The ball is bowled. The batter plays it. The score stays the same.
The statistic applies to all formats. Test. ODI. T20. The benchmark shifts. The calculation stays the same.
Dot ball percentage in cricket has grown in importance. The early scorecards tracked dot balls. But the statistic sat behind the economy rate in prominence. The modern game changed that. T20 cricket made pressure the primary currency. The dot ball percentage measures that pressure.
The number is simple to read. A higher percentage means the bowler restricts scoring. A lower percentage means the opposite. Cricket terminology treats this as a key bowling metric. Sports statistics place it alongside the economy rate for modern analysis.
The statistic captures control. A bowler with a high dot ball percentage hits the right lengths. A bowler with a low percentage sprays the ball. The dot ball percentage tells you which one the bowler is.
The scorecard tracks the dot balls through the innings. The commentator mentions the figure. The analyst uses it. The captain builds the bowling plan around it. The statistic has moved from the margins to the centre.
The Formula Explained
The formula for dot ball percentage is straightforward.
Dot Ball Percentage = (Dot Balls Bowled ÷ Total Balls Bowled) × 100
The result is expressed as a percentage. 40% means 40 deliveries out of every 100 produce no runs. 60% means 60 out of 100.
The key detail is the total balls bowled. The number includes every delivery the bowler sends down. Wides and no-balls count as deliveries. They do not count as dot balls. A wide produces a run. A no-ball produces a run. The dot ball is a legal delivery with no run.
Cricket rules define which deliveries count as dot balls. The byes and leg byes do not count against the bowler. A delivery that produces a bye is not a dot ball for the bowler. The scorecard tracks the distinction. The dot ball percentage respects the definition.
The calculation runs through the spell. A bowler who bowls four overs faces 24 deliveries. The dot balls are counted. The total is divided. The percentage appears. The figure updates through the match.
A Worked Example
Take a bowler in a T20 match. They bowl four overs. That is 24 deliveries. They concede 24 runs. But the runs come from 12 scoring shots. The other 12 deliveries produce no runs.
The calculation is (12 ÷ 24) × 100 = 50%. The dot ball percentage is 50%.
That is a strong figure. The bowler produces a dot ball on half the deliveries. In T20 cricket, a dot ball percentage above 40% is strong. Above 50% is excellent.
Now take a different bowler. They bowl four overs. They concede 40 runs. The runs come from 18 scoring shots. The other 6 deliveries produce no runs.
The calculation is (6 ÷ 24) × 100 = 25%. The dot ball percentage is 25%.
That is a low figure. The bowler concedes runs on most deliveries. The batting side scores freely. The pressure releases.
The two spells show the range. The same format. The same overs. The different percentage. The first bowler built pressure. The second did not.
The contrast matters for the match. The first bowler kept the required rate in check. The second let the batting side accelerate. The dot ball percentage captures the difference.
What a High Dot Ball Percentage Tells You
A high dot ball percentage means the bowler restricts scoring. Control. Pressure. The opposition scores slowly.
The bowler hits the right lengths. They vary the pace. They use the yorker. They keep the batter guessing. The runs dry up. The pressure builds. The wickets often follow.
Player performance is tied to this in limited-overs cricket. A bowler with a high dot ball percentage is a match-winner. The team can defend totals. The chase becomes harder. The required rate climbs.
In ODI cricket, the dot ball percentage matters through the middle overs. A bowler who produces dots builds pressure. The batting team falls behind the rate. The wickets follow.
In T20 cricket, the dot ball percentage is the primary metric. A bowler who produces dots keeps the team in the match. The batting side faces the pressure. The required rate climbs.
In Test cricket, the dot ball percentage still matters. But the value shifts. A bowler who produces dots builds pressure over long spells. The batting side faces the grind. The wickets come from patience.
The high percentage also protects the bowler’s economy rate. The dots restrict the runs. The economy rate stays low. The two statistics work together.
What a Low Dot Ball Percentage Tells You
A low dot ball percentage means the bowler concedes runs often. The batting side scores freely. The pressure releases.
This is not always a negative. A strike bowler in Test cricket may concede more runs while attacking. The role is to take wickets. The dot ball percentage suffers. The wickets compensate.
The context matters. A containing bowler with a low dot ball percentage is a problem. A strike bowler with a low dot ball percentage may be playing the role correctly.
The role shapes the expectation. A death bowler is judged on dot balls. A strike bowler is judged on wickets. The dot ball percentage reflects the first role better than the second.
A string of low percentages signals trouble. The bowler concedes runs across the spell. The batting side scores freely. The pressure stays off. The wickets do not come.
What Dot Ball Percentage Misses
Dot ball percentage does not tell the whole story. Here is what the number leaves out.
Wickets. A bowler with a high dot ball percentage may not take wickets. The statistic does not measure wicket-taking. A bowler who produces dots but takes no wickets may not win the match.
The type of dot ball. A dot ball can result from good bowling or from the batter defending. The statistic does not distinguish. A defensive dot on a flat pitch is different from an attacking dot on a turning track.
Match situation. A bowler defending a big total can afford a lower percentage. A bowler defending a small total cannot. The statistic treats both the same.
Pitch conditions. A high dot ball percentage on a flat pitch may be excellent. The same percentage on a turning track may be standard. The statistic does not adjust for the surface.
Opposition quality. Dot balls against a weak batting line-up count the same as dot balls against a strong one.
Match analysis uses dot ball percentage as one input. Not the only one. The statistic is a starting point. The context completes the picture.
The limits do not make the statistic useless. They define what it can and cannot do. The dot ball percentage tells you about pressure. It does not tell you about wicket-taking. Both matter. The reader needs both.
Dot Ball Percentage Across Formats
The statistic varies by format.
Test cricket. Dot ball percentages are usually the highest. Test matches last five days. Bowlers build pressure over long spells. Dot ball percentages in the 60% to 75% range are common.
ODI cricket. Dot ball percentages sit in the middle. 50-over matches give bowlers 10 overs. Dot ball percentages in the 40% to 55% range are common. Elite ODI bowlers produce dots above 55%.
T20 cricket. Dot ball percentages are lower. The format rewards batters. Bowlers concede more runs. Dot ball percentages in the 30% to 45% range are common. Elite T20 bowlers produce dots above 45%.
The difference matters for interpretation. A 60% dot ball percentage in Test cricket is standard. The same number in T20 cricket is exceptional. The format shapes the number.
The phase matters too. The powerplay produces more dots. The field is up. The bowlers attack. The middle overs balance the dots and the boundaries. The death overs produce fewer dots. The batters attack.
The Pressure Game: Dot Balls and Wickets
The dot ball percentage connects to wickets. The connection is pressure.
Here is the pattern. The bowler produces dots. The batter faces the pressure. The required rate climbs. The batter takes a risk. The risk produces a mistake. The mistake produces a wicket.
The pattern repeats through the innings. The dot balls build the pressure. The pressure produces the wickets. The wickets decide the match.
The connection is not automatic. A bowler can produce dots and take no wickets. The batting side may survive the pressure. But the pressure shifts the odds. The team that builds pressure wins more often.
The modern game values the pressure phase. T20 cricket rewards bowlers who produce dots. The middle overs decide the match. The dot ball percentage measures the middle-overs control.
The pressure also affects the batting side’s plans. The dots force the batters to take risks. The risks produce the wickets. The wickets end the partnerships. The partnerships decide the total. The cycle runs through the match.
How to Read Dot Ball Percentages
The benchmarks shift by format. A dot ball percentage above 75% in Test cricket signals a top bowler. The 60% to 75% range is strong. Below 50% is a concern for a frontline bowler.
In ODI cricket, the elite mark sits above 55%. Between 45% and 55% is strong. Below 35% is a concern for a specialist bowler.
In T20 cricket, above 45% stands out. Between 35% and 45% is strong. Below 25% is a concern.
These ranges are guides. They shift with eras. They shift with roles. The modern game has higher scoring rates. The dot ball percentages reflect that.
The reader should check the phase. A bowler who produces dots in the powerplay is valuable. A bowler who produces dots in the death overs is exceptional. The context shifts the expectation.
Dot Ball Percentage vs Economy Rate
A bowler finishes with four overs, 24 runs, and a 50% dot ball percentage. The economy rate sits at 6.00. The two numbers tell different stories. Here is how they connect.
Economy rate. Runs conceded per over. Measures a bowler’s run control. A low number is good for the bowler.
Dot ball percentage. The proportion of deliveries with no runs. Measures a bowler’s pressure. A high number is good for the bowler.
The two statistics move together most of the time. A bowler with a high dot ball percentage usually has a low economy rate. The dots restrict the runs. The runs stay low.
But the two can diverge. A bowler may produce dots and then concede a boundary. The dot ball percentage stays high. The economy rate climbs. The reverse can happen. A bowler may concede singles but no boundaries. The economy rate stays low. The dot ball percentage stays low.
The two statistics are read together. The dot ball percentage shows the pressure. The economy rate shows the total runs. Both matter. The reader needs both.
When a commentator mentions dot ball percentage, the context is pressure. When the context is total runs, the statistic is the economy rate. The two are not interchangeable.
The Bottom Line: A Statistic Worth Understanding
Dot ball percentage explained is simple. The proportion of deliveries with no runs. The statistic measures pressure. It tells you how well a bowler restricts the scoring.
The calculation matters. Only legal deliveries with no runs count. Wides and no-balls do not. The distinction shapes the number.
The limits matter too. Dot ball percentage does not measure wickets. It does not capture the type of dot. The statistic is one input among many. The modern game reads it alongside the economy rate.
Dot ball percentage in cricket has grown from a secondary metric to a core one. It defines the pressure bowler. Understanding how dot ball percentage works is the key to reading the modern game.